Planner to Power BI: how to connect it and what it costs
Power BI has no built-in connector for basic Planner plans. Connect them step by step with Power Automate or the Graph API, and see costs and refresh limits.
To connect Microsoft Planner to Power BI, you copy the tasks to a place Power BI can read, such as a SharePoint list, with Power Automate or the Microsoft Graph API. Power BI has no built-in Planner connector for the basic plans your teams use in Teams, so you build and maintain that pipeline yourself. If you only need a live overview of tasks across plans, Heliview shows several Planner plans in one view without that build.
Does Power BI have a Planner connector?
No. Power BI has no built-in connector for Microsoft Planner. Microsoft does offer a Power BI template for projects, but it reads premium plans through Dataverse and needs a Planner and Project Plan 3 or Plan 5 license. For basic plans in Teams, that template doesn’t apply.
Three ways to get Planner data into Power BI
For basic plans, teams usually take one of these routes:
- Microsoft Graph API. You fetch the tasks per plan with the Web connector in Power BI. Someone has to set up the connection, the permissions and the lookups that turn IDs into plan, bucket and user names.
- Power Automate. A flow writes tasks to a SharePoint list or an Excel file, and Power BI reads that file. The result is only as good as the flow. The Planner connector has no trigger for a changed task, so you need another way to pick up updates.
- A paid third-party connector, such as CData or FluentPro.
How to connect Planner to Power BI with Power Automate
This route needs no code. The work is in the details: names instead of IDs, and no duplicate rows.
- Create a SharePoint list with a column for each field you want to report on: task title, plan, bucket, assignee, progress, priority, start date and due date. Add a column for the task ID.
- Create a scheduled cloud flow in Power Automate with the Recurrence trigger, for example once a day.
- Add the Planner action “List tasks”. It asks for a group (the team) and a plan. Repeat the action for every plan you want in the report.
- Turn IDs into names. “List tasks” returns bucket and user IDs. Add “List buckets” for the bucket names, and the Office 365 Users action “Get user profile (V2)” for each assignee.
- Write each task to the list. Use “Apply to each”. Look up the task ID with the SharePoint action “Get items”, then use “Update item” if it exists and “Create item” if it doesn’t. Without that check, every run adds the same tasks again.
- Connect Power BI. In Power BI Desktop, choose Get data, then SharePoint Online list, and pick your list. Build the report, publish it and set a scheduled refresh.
Keep an eye on the limits. The Planner connector allows 100 calls per connection per minute, so a flow over many plans and hundreds of tasks needs to run slower or in batches.
The Graph API route in short
Developers can skip the list. The Graph endpoint GET /planner/tasks with a planId filter returns the tasks of one plan. A Microsoft Entra app needs the Tasks.Read permission (or Tasks.Read.All for an app without a signed-in user), and someone has to handle tokens, paging and the same ID lookups as in step 4.
Who can open the report
Sharing a report takes a paid Power BI license. The free version lets you build reports for yourself, not share them. Power BI Pro costs $14 per user per month and Premium Per User $24, paid yearly. If ten team leads need the dashboard, all ten need Pro, unless your organization already has Premium or Fabric capacity.
How current the data is
A semantic model on shared capacity (Pro) refreshes on schedule at most 8 times a day. On Premium, Premium Per User or Fabric capacity, you can schedule up to 48. A task that gets a new due date at 10:05 won’t show up in the dashboard right away. That’s fine for a monthly report. For “what’s due today?”, it’s too slow.
When Power BI is the right choice
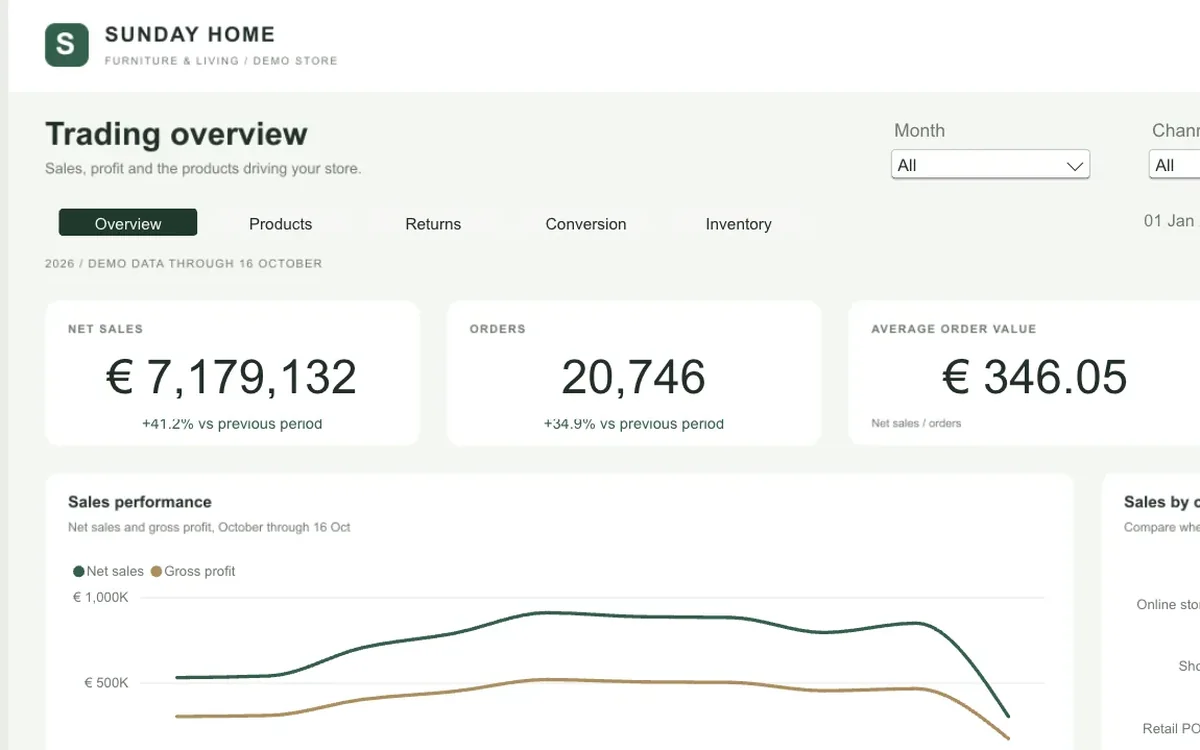
Power BI is strong when you want trends: how many tasks get completed per month, how long tasks stay open, how teams compare over a quarter. Those questions are about history and numbers, and a dashboard answers them well.
Day to day, a team lead needs something else: the tasks themselves, a click to open one, a filter on a colleague and a list of what’s due this week. That’s a task overview.
A live task overview across plans
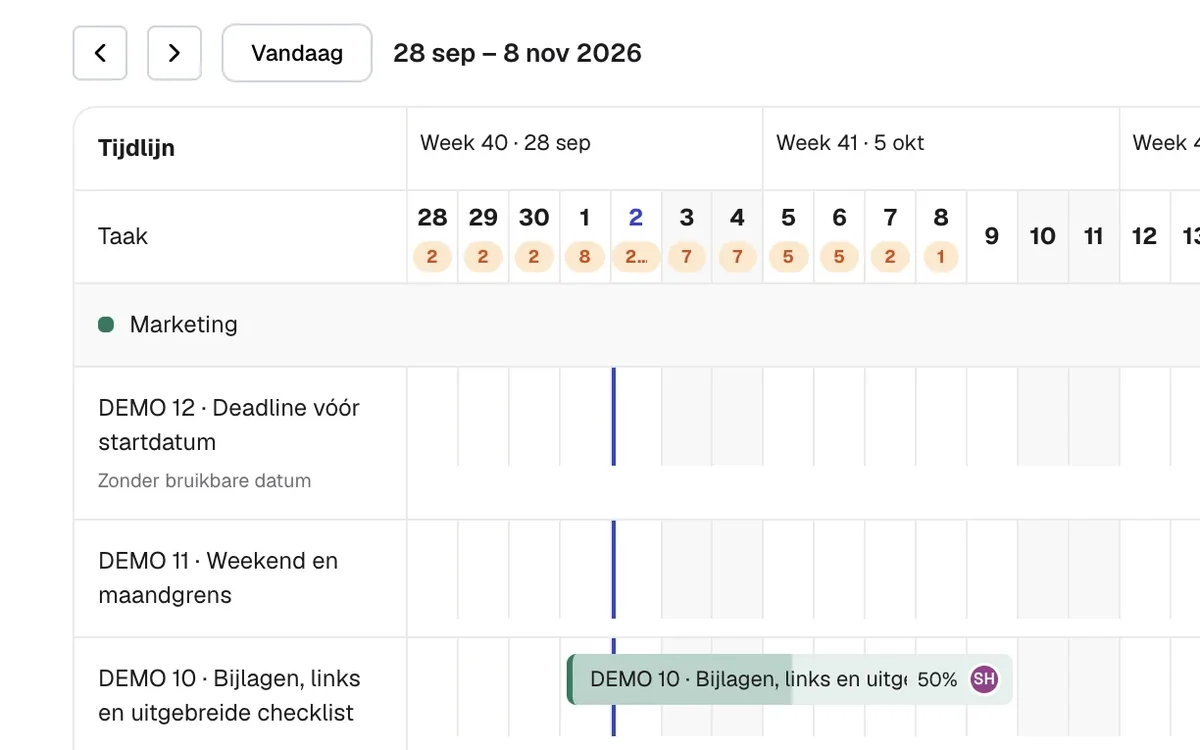
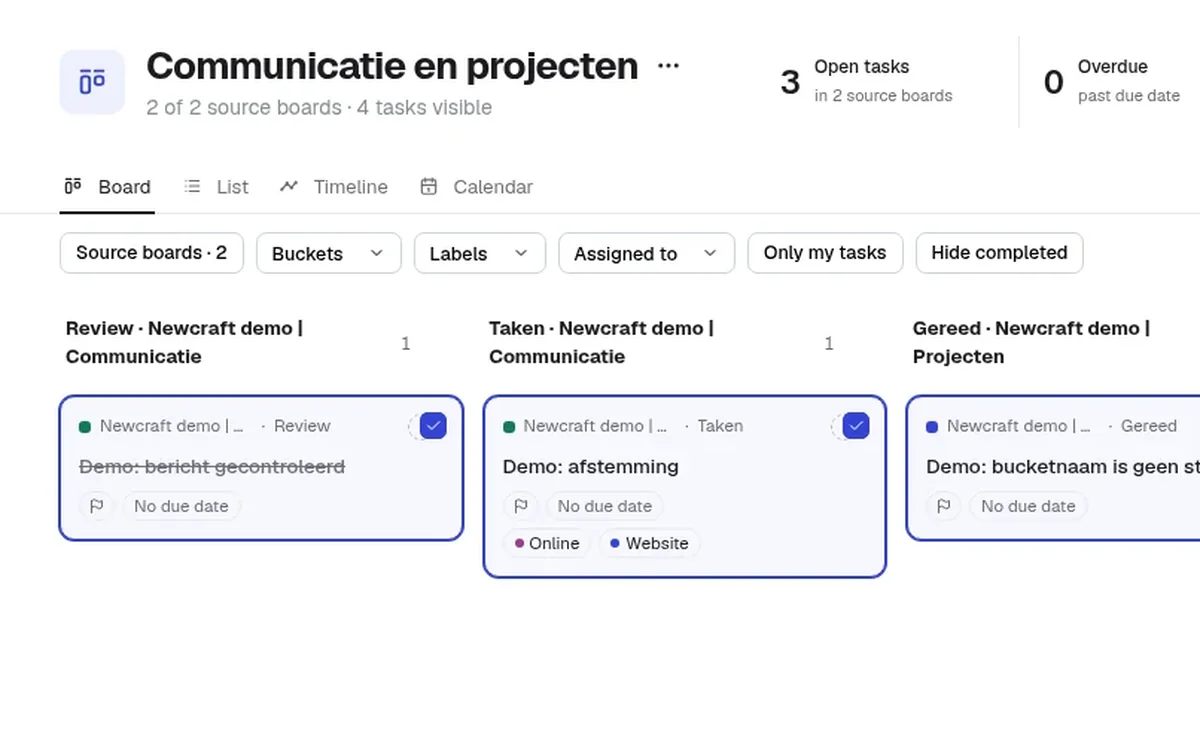
Heliview reads your basic Planner plans at the moment you look. You pick which plans belong together and see their tasks as a board, list, timeline or calendar. Filters on assignee, bucket, label, due date, progress and priority stay saved per view.
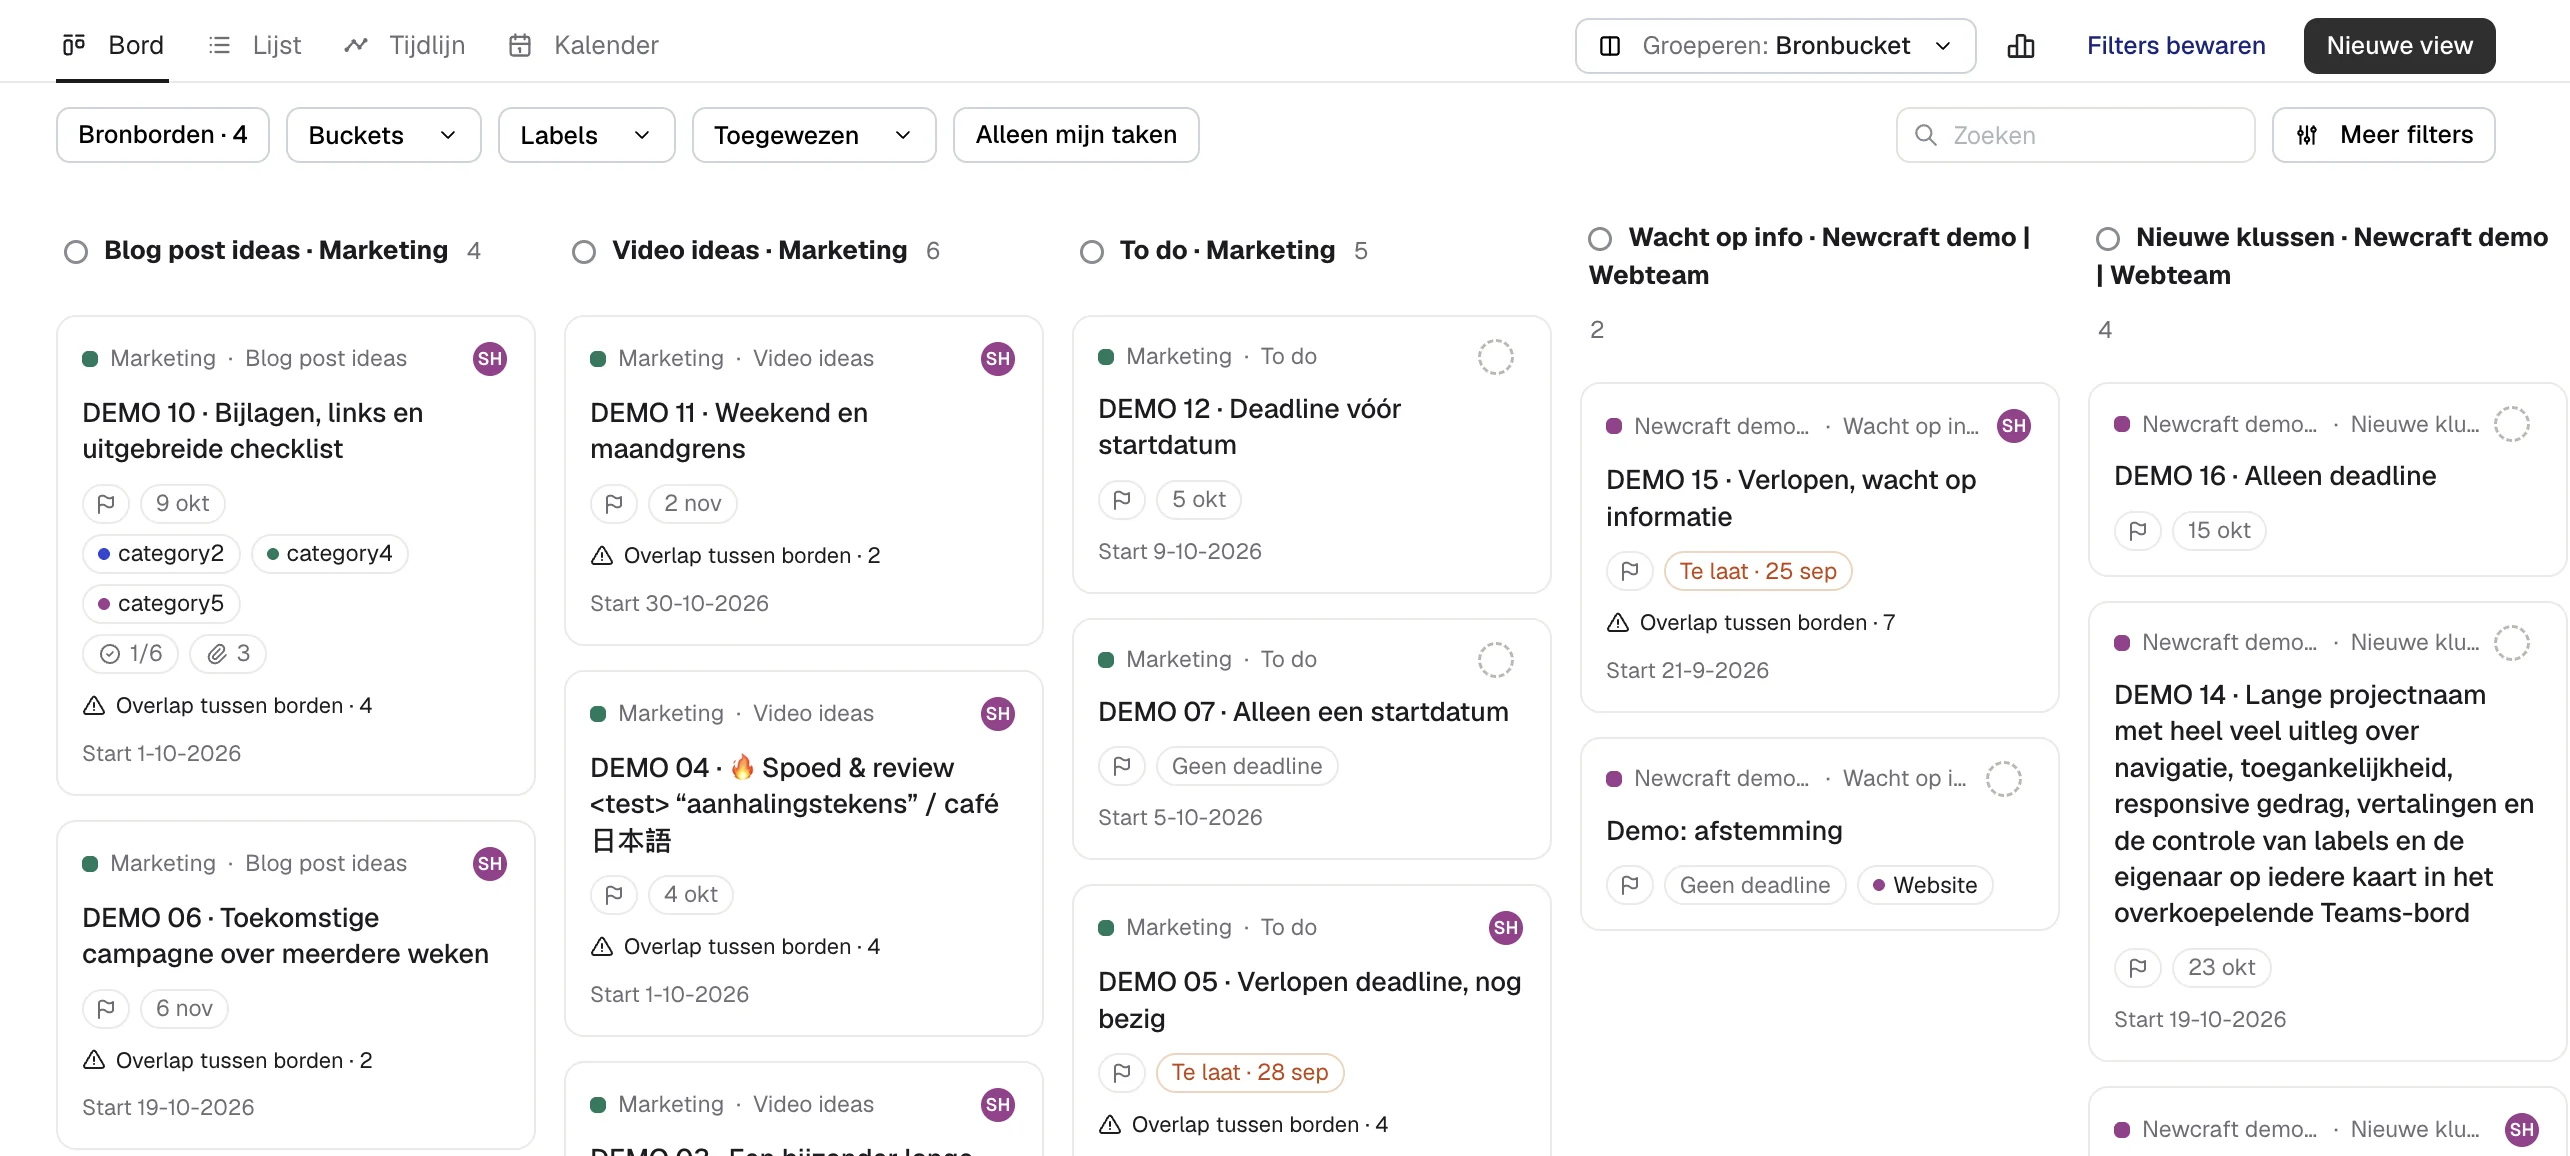
Everyone who opens the view signs in with their own Microsoft work account and sees only what they can already open in Planner. You pay per number of boards, with unlimited users. See Heliview pricing.
Want one big plan instead? Four ways to build a master plan compares the options. Thinking about portfolios? Read what Planner portfolios need first.
Sources
- Getting data from Microsoft Planner in Power BI, Microsoft Fabric Community
- Use Power BI Desktop to connect with your project data, Microsoft Support
- Power BI pricing, Microsoft (US prices, October 2026)
- Data refresh in Power BI, Microsoft Learn
- Planner connector for Power Automate, Microsoft Learn
- List plannerTask objects, Microsoft Learn
- SharePoint Online list connector, Microsoft Learn